
The Traphagen Recession Index (TRI) is a proprietary economic index developed by Traphagen as a tool to help predict US GDP growth rates and possible recessions. The TRI incorporates several different factors that have had a history of predicting recessionary periods months ahead of the official recession start. Some of the factors we actively monitor and are incorporated into the index include US corporate profit margins, Treasury yield spreads/trends, non-farm payroll trends, two different Leading Economic Indicators (LEI).
The TRI can range from 0 to 100 (although for the vast majority of the time should be in the 10 to 70 range). The index levels should be interpreted as ‘the percentage of a recession within the next 12 months’. Therefore, if the current index level is ‘35’, that means there is approximately a 35% chance of a US recession over the next year. The ‘average’ chance of a recession over any 1 year period is about 15%.
Traphagen developed the index for two main reasons. First, we wanted a reliable, diversified, and useful tool that would assist us in predicting recessions and economic growth rates over the intermediate term. This index is one of many tools we use to help position our client portfolios. Secondly, we wanted to give our clients an easy and accessible way to view our opinion on the US economy over time.
CURRENT TRI INDEX
41.9% |
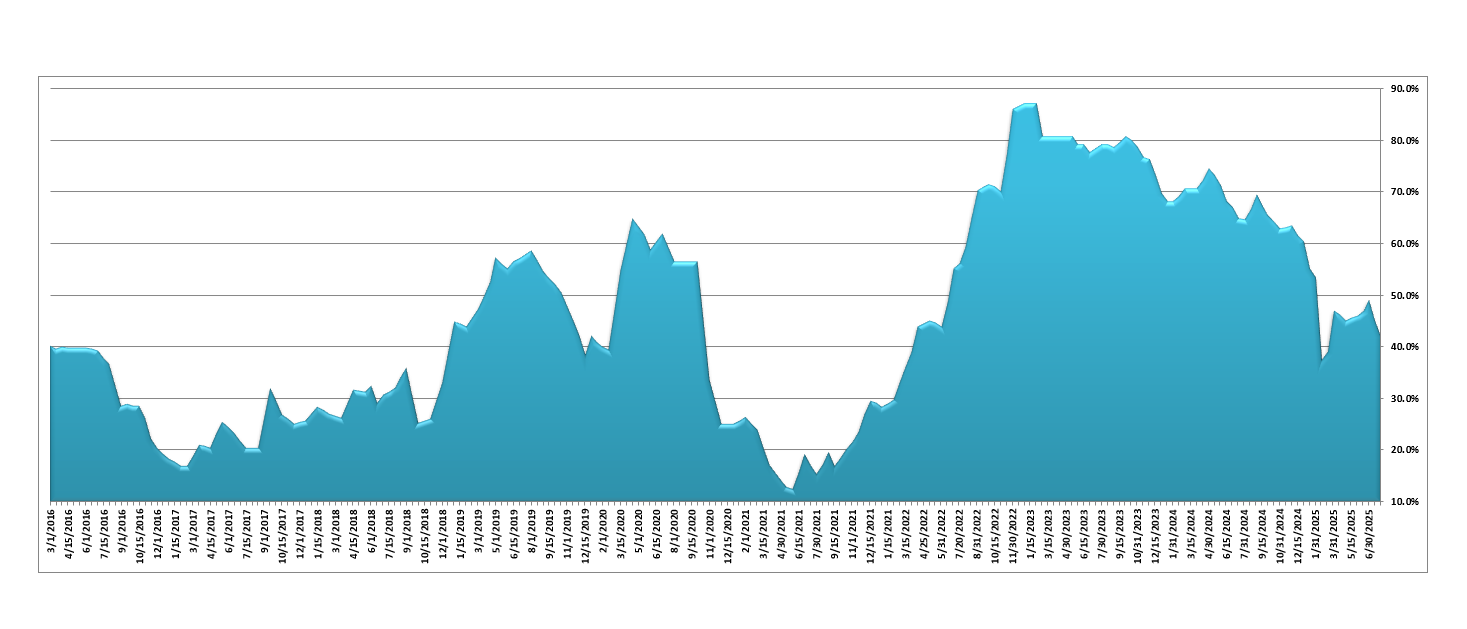
HISTORICAL CHART
How Investors and Clients Should View the ‘TRI’
The ‘TRI’ is one of many tools and resources Traphagen utilizes to analyze the overall economy and financial markets. The ‘TRI’ level does not represent Traphagen’s overall view of the likelihood of a recession, as it is only one of many metrics/data points used in forming our overall economic view and portfolio stance. It is possible for the ‘TRI’ to be elevated, but our view of a recession occurring to be quite low and vice versa. Along the same lines, if the TRI is high, our portfolios could still be aggressively positioned and when the ‘TRI’ metric is low, we could be in a defensive position. We have included the ‘TRI’ on our website as one specific example of the research we do at the firm and should be viewed as such.
DETAILED DASHBOARD
| Fiscal Policy & Federal Debt Spending | |
| % CHANCE OF REC. BASED ON ABOVE METRIC | 15% |
| 10 Year vs. 2 Year Treasury Note Spread | |
| % CHANCE OF REC. BASED ON ABOVE METRIC | 35% |
| Treasury Curve Shape & Recent Trend |
|
| % CHANCE OF REC. BASED ON ABOVE METRIC | 80% |
|
|
|
| Conference Board ‘Leading Economic Indicator’ | |
| % CHANCE OF REC. BASED ON ABOVE METRIC | 90% |
| AIER Leading Economic Indicator | |
| % CHANCE OF REC. BASED ON ABOVE METRIC | 10% |
| Stock Market Action/Breadth | |
| % CHANCE OF REC. BASED ON ABOVE METRIC | 5% |
| SP500 Profit Margin & Trend | |
| % CHANCE OF REC. BASED ON ABOVE METRIC | 65% |
FAQ
Q: What is the Traphagen Recession Index (TRI)?
A: Traphagen has incorporated 6-7 different factors that have had a great history of predicting past recessions while at the same time limiting the amount of ‘false positives’ (or predicting recessions that never happened). We then weight all these factors differently and aggregate all signals into the overall TRI reading.
Q: When did Traphagen develop this index?
A: Traphagen began research on the index and many different factors in late 2015 and developed the first iteration of the TRI in January of 2016. Overall we expect the TRI to remain largely unchanged through time, but if certain factors lose their predictive ability or others seem more important we can add and/or subtract pieces of the index.
Q: How often is the index updated?
A: Traphagen updates all factors and calculates the new TRI index level once per month.
Q: I am a writer, author, reporter, or other interested party, can I use or quote your index level in my work?
A: You may, all we ask is that you cite the index with the source and Traphagen.
Discover how we can help.
CONTACT US